DreamFactory ELK Stack & Grafana Integration Guide
This guide provides step-by-step instructions for installing and configuring Elasticsearch, Logstash, and Grafana to work with DreamFactory's Logstash connector for API activity monitoring and analytics.
Table of Contents
Prerequisites
- Ubuntu Server (20.04 or later recommended)
- Root or sudo access
- Minimum 2GB RAM (4GB+ recommended)
- Java 11 or later
- DreamFactory instance with Logstash connector enabled
Installation
Elasticsearch
Step 1: Install Java
sudo apt update
sudo apt install -y openjdk-11-jdk
Step 2: Add Elasticsearch Repository
wget -qO - https://artifacts.elastic.co/GPG-KEY-elasticsearch | sudo apt-key add -
echo "deb https://artifacts.elastic.co/packages/8.x/apt stable main" | sudo tee /etc/apt/sources.list.d/elastic-8.x.list
sudo apt update
Step 3: Install Elasticsearch
sudo apt install -y elasticsearch
Step 4: Configure Elasticsearch Memory
For systems with limited RAM, reduce heap size:
sudo mkdir -p /etc/elasticsearch/jvm.options.d
sudo tee /etc/elasticsearch/jvm.options.d/heap.options << EOF
-Xms256m
-Xmx256m
EOF
Step 5: Start and Enable Elasticsearch
sudo systemctl daemon-reload
sudo systemctl enable elasticsearch
sudo systemctl start elasticsearch
Step 6: Verify Installation
Wait 30 seconds, then check status:
sudo systemctl status elasticsearch
Get the default password:
sudo /usr/share/elasticsearch/bin/elasticsearch-reset-password -u elastic
Test connection:
curl -k -u elastic:YOUR_PASSWORD https://localhost:9200
Logstash
Step 1: Install Logstash
sudo apt install -y logstash
Step 2: Configure Logstash Memory
sudo tee /etc/logstash/jvm.options << EOF
-Xms256m
-Xmx256m
EOF
Step 3: Create Logstash Configuration
Create the DreamFactory configuration file:
sudo tee /etc/logstash/conf.d/dreamfactory.conf << 'EOF'
input {
  gelf {
    port => 12201
    type => "dreamfactory"
  }
}

filter {
  if [type] == "dreamfactory" {
    # Rename host field to avoid conflict with ECS (Elastic Common Schema) host object
    # Note: ECS is a vendor-neutral standard that works across all cloud providers and on-premise
    if [host] {
      mutate {
        rename => { "host" => "source_hostname" }
      }
    }

    # Add host information as object for ECS compatibility
    # This follows the ECS standard and works on AWS, Azure, GCP, on-premise, etc.
    mutate {
      add_field => {
        "log_source" => "dreamfactory"
        "[host][name]" => "%{source_hostname}"
      }
    }

    # Parse log level if present
    if [level] {
      mutate {
        uppercase => [ "level" ]
      }
    }

    # Extract user_id from JWT session token
    ruby {
      code => '
        begin
          # Access nested field directly
          event_data = event.get("event")
          if event_data && event_data.is_a?(Hash)
            request_data = event_data["request"]
            if request_data && request_data.is_a?(Hash)
              headers = request_data["headers"]
              if headers && headers.is_a?(Hash)
                token = headers["x-dreamfactory-session-token"]
                if token && token.is_a?(String) && token.include?(".")
                  parts = token.split(".")
                  if parts.length >= 2
                    payload_b64 = parts[1]
                    # Add padding for base64 URL-safe decoding
                    padding = (4 - payload_b64.length % 4) % 4
                    payload_b64 += "=" * padding
                    # Decode and parse
                    require "base64"
                    require "json"
                    payload_json = Base64.urlsafe_decode64(payload_b64)
                    payload = JSON.parse(payload_json)
                    if payload["user_id"]
                      event.set("[user][id]", payload["user_id"])
                    end
                  end
                end
              end
            end
          end
        rescue => e
          # Silently fail
        end
      '
    }
  }
}

output {
  elasticsearch {
    hosts => ["https://localhost:9200"]
    user => "elastic"
    password => "YOUR_ELASTICSEARCH_PASSWORD"
    ssl_enabled => true
    ssl_verification_mode => "none"
    index => "logstash-dreamfactory-%{+YYYY.MM.dd}"
  }
}
EOF
Important: Replace YOUR_ELASTICSEARCH_PASSWORD with the password you obtained in Step 6 of Elasticsearch installation.
Step 4: Set File Permissions
sudo chown logstash:logstash /etc/logstash/conf.d/dreamfactory.conf
sudo chmod 644 /etc/logstash/conf.d/dreamfactory.conf
Step 5: Test Configuration
sudo /usr/share/logstash/bin/logstash --path.settings=/etc/logstash --config.test_and_exit
Step 6: Start and Enable Logstash
sudo systemctl daemon-reload
sudo systemctl enable logstash
sudo systemctl start logstash
Step 7: Verify Installation
sudo systemctl status logstash
sudo tail -f /var/log/logstash/logstash-plain.log
Grafana
Step 1: Install Dependencies
sudo apt install -y software-properties-common
sudo add-apt-repository "deb https://packages.grafana.com/oss/deb stable main"
Step 2: Add Grafana GPG Key
wget -q -O - https://packages.grafana.com/gpg.key | sudo apt-key add -
sudo apt update
Step 3: Install Grafana
sudo apt install -y grafana
Step 4: Start and Enable Grafana
sudo systemctl daemon-reload
sudo systemctl enable grafana-server
sudo systemctl start grafana-server
Step 5: Access Grafana Web UI
Open your browser and navigate to:
http://YOUR_SERVER_IP:3000
Default credentials:
- Username:
admin - Password:
admin(you'll be prompted to change it)
Configuration
Elasticsearch Configuration
Basic Security Settings
Elasticsearch 8.x has security enabled by default. The default user is elastic with a randomly generated password.
Index Management
Logs are automatically indexed with the pattern: logstash-dreamfactory-YYYY.MM.dd
View indices:
curl -k -u elastic:YOUR_PASSWORD https://localhost:9200/_cat/indices?v
Elasticsearch 8 Compatibility: Security Enabled by Default
Elasticsearch 8.x introduces a significant breaking change from ES7: TLS encryption and authentication are enabled by default. If you are migrating from Elasticsearch 7 or configuring a fresh ES8 installation, connections that worked without credentials in ES7 will fail with connection refused or SSL handshake failed errors in ES8.
When you install Elasticsearch 8 for the first time, the installer outputs a randomly generated password for the elastic superuser and enrolls Kibana automatically with a token. You must save these credentials — the password is shown only once. To reset it:
sudo /usr/share/elasticsearch/bin/elasticsearch-reset-password -u elastic
You have two options for configuring your Logstash-to-Elasticsearch connection with ES8:
Option A: Configure Logstash to Use HTTPS with ES8 Credentials (Recommended for Production)
Update the output block in your /etc/logstash/conf.d/dreamfactory.conf to include TLS settings and credentials. The CA certificate for self-signed ES8 installs is located at /etc/elasticsearch/certs/http_ca.crt:
output {
  elasticsearch {
    hosts => ["https://localhost:9200"]
    user => "elastic"
    password => "YOUR_ELASTICSEARCH_PASSWORD"
    ssl_enabled => true
    # Option 1: Provide the CA cert for full certificate verification (most secure)
    ssl_certificate_authorities => ["/etc/elasticsearch/certs/http_ca.crt"]
    # Option 2: Skip verification (acceptable for same-host setups, not for remote ES)
    # ssl_verification_mode => "none"
    index => "dreamfactory-logs-%{+YYYY.MM.dd}"
  }
}
Copy the CA certificate so Logstash can read it:
sudo cp /etc/elasticsearch/certs/http_ca.crt /etc/logstash/
sudo chown logstash:logstash /etc/logstash/http_ca.crt
sudo chmod 640 /etc/logstash/http_ca.crt
Then update the ssl_certificate_authorities path in your Logstash config to /etc/logstash/http_ca.crt.
Verify the connection works from Logstash's perspective:
curl --cacert /etc/elasticsearch/certs/http_ca.crt \
     -u elastic:YOUR_PASSWORD \
     https://localhost:9200
You should see the ES cluster info JSON — if you do, the certificate and credentials are correct.
Option B: Disable ES8 Security (Non-Production Only)
Disabling Elasticsearch security removes authentication and TLS protection. Do not use this in production or on any network-accessible host. This is only appropriate for local development or isolated test environments.
To disable ES8 security, edit /etc/elasticsearch/elasticsearch.yml and add:
xpack.security.enabled: false
xpack.security.http.ssl.enabled: false
xpack.security.transport.ssl.enabled: false
Then restart Elasticsearch:
sudo systemctl restart elasticsearch
With security disabled, your Logstash output block reverts to the simpler ES7-style config:
output {
  elasticsearch {
    hosts => ["http://localhost:9200"]
    index => "dreamfactory-logs-%{+YYYY.MM.dd}"
  }
}
Logstash Configuration Reference
The following is a complete, annotated logstash.conf for DreamFactory's GELF log output. Save this as /etc/logstash/conf.d/dreamfactory.conf:
# =============================================================
# DreamFactory → Logstash → Elasticsearch Pipeline
# =============================================================

input {
  # DreamFactory sends logs via GELF (Graylog Extended Log Format) over UDP.
  # Default port is 12201. Configure the same port in DreamFactory Admin >
  # Services > Logstash connector settings.
  gelf {
    port => 12201
    type => "dreamfactory"
  }
}

filter {
  if [type] == "dreamfactory" {

    # DreamFactory log fields (top-level):
    #   host        - hostname of the DreamFactory server
    #   level       - log severity: DEBUG, INFO, WARNING, ERROR
    #   short_message - brief description of the event
    #   full_message  - full event payload (may include request/response)
    #   timestamp   - event time (Unix epoch)
    #
    # DreamFactory event fields (nested under [event]):
    #   [event][request][method]   - HTTP method: GET, POST, PUT, DELETE, PATCH
    #   [event][request][uri]      - full request URI, e.g. /api/v2/mydb/_table/orders
    #   [event][request][service]  - service name, e.g. "mydb", "system", "files"
    #   [event][request][resource] - resource path within the service
    #   [event][request][headers]  - request headers map (includes API key and session token)
    #   [event][response][status]  - HTTP response status code
    #   [event][response][content] - response body (if log level includes response)

    # Rename [host] string to avoid conflict with ECS [host] object
    if [host] {
      mutate {
        rename => { "host" => "source_hostname" }
        add_field => { "[host][name]" => "%{source_hostname}" }
      }
    }

    mutate {
      add_field => { "log_source" => "dreamfactory" }
      uppercase => [ "level" ]
    }

    # Extract user_id from the DreamFactory JWT session token so dashboards
    # can show per-user activity without requiring a separate lookup.
    ruby {
      code => '
        begin
          event_data = event.get("event")
          if event_data&.is_a?(Hash)
            token = event_data.dig("request", "headers", "x-dreamfactory-session-token")
            if token.is_a?(String) && token.include?(".")
              parts = token.split(".")
              if parts.length >= 2
                require "base64"
                require "json"
                padding = (4 - parts[1].length % 4) % 4
                payload = JSON.parse(Base64.urlsafe_decode64(parts[1] + "=" * padding))
                event.set("[user][id]", payload["user_id"]) if payload["user_id"]
              end
            end
          end
        rescue => e
          # silently skip malformed tokens
        end
      '
    }
  }
}

output {
  elasticsearch {
    # Use https:// for Elasticsearch 8.x (security enabled by default).
    # Switch to http:// only if you have explicitly disabled xpack.security.
    hosts => ["https://localhost:9200"]
    user => "elastic"
    password => "YOUR_ELASTICSEARCH_PASSWORD"
    ssl_enabled => true
    ssl_certificate_authorities => ["/etc/logstash/http_ca.crt"]
    # Index pattern: creates one index per day for easier lifecycle management.
    # Grafana datasource index pattern should be set to "dreamfactory-logs-*"
    index => "dreamfactory-logs-%{+YYYY.MM.dd}"
  }
}
After saving the file, test the configuration before starting:
sudo /usr/share/logstash/bin/logstash \
  --path.settings=/etc/logstash \
  --config.test_and_exit
A successful test outputs Configuration OK. Then restart Logstash:
sudo systemctl restart logstash
sudo journalctl -u logstash -f
Grafana Dashboard Setup
Once Logstash is indexing DreamFactory events into Elasticsearch, connect Grafana to visualize the data.
Connecting Grafana to the dreamfactory-logs-* Index
In Grafana, navigate to Connections → Data Sources → Add data source → Elasticsearch. Use these settings:
| Field | Value |
|---|---|
| URL | https://localhost:9200 |
| Access | Server (default) |
| Basic Auth | Enabled |
| User | elastic |
| Password | Your Elasticsearch password |
| TLS/SSL mode | Skip TLS verification (or provide CA cert) |
| Index name | dreamfactory-logs-* |
| Time field | @timestamp |
| Version | 8.0+ |
Click Save & Test — you should see "Data source connected and index found."
Dashboard Panels to Create
Build panels that answer the operational questions your team cares about most:
1. Requests per Minute
- Visualization: Time series
- Query: Count all documents with
type:dreamfactory - Bucket aggregation: Date histogram on
@timestamp, interval1m - This shows throughput trends and helps identify traffic spikes.
2. Error Rate by HTTP Status Code
- Visualization: Bar chart or time series
- Query:
event.response.status:>=400 - Bucket aggregations: Date histogram → Terms on
event.response.status - Use a threshold alert at >5% error rate to catch service degradation early.
3. Top API Consumers by API Key / User
- Visualization: Table
- Query:
event.request.method:* - Bucket aggregation: Terms on
user.id(size 20, order by count desc) - Join with DreamFactory's
/api/v2/system/userendpoint (via Grafana Infinity datasource) to resolve user IDs to email addresses.
4. Slowest Endpoints
- Visualization: Table sorted by average response time
- Requires DreamFactory to log response duration. If the
full_messagefield includes timing data, parse it with a Logstashgrokfilter and store it asresponse_ms. - Query:
event.request.uri:* - Aggregation: Terms on
event.request.uri.keyword→ Avg onresponse_ms
Importing a Pre-Built Dashboard
If DreamFactory provides a dashboard JSON export:
- In Grafana, click Dashboards → Import
- Upload the JSON file or paste its contents
- Select your
DreamFactory LogsElasticsearch datasource when prompted - Click Import
The dashboard will appear under your configured folder. Set the default time range to Last 24 hours and auto-refresh to 1 minute.
Troubleshooting ELK Integration
Connection Refused to Elasticsearch
Symptom: Logstash logs show Connection refused - connect(2) for "localhost" port 9200 or Grafana shows "No data."
Causes and fixes:
- Elasticsearch is not running:
sudo systemctl status elasticsearch. Start it if stopped. - Firewall is blocking port 9200:
sudo ufw allow 9200/tcp(or adjust your iptables rules). - ES8 is running on HTTPS but Logstash is configured with
http://: changehoststo["https://localhost:9200"].
Index Not Created in Elasticsearch
Symptom: Logstash starts without errors but no dreamfactory-logs-* index appears.
Causes and fixes:
- Logstash is not receiving GELF events from DreamFactory yet — generate some API calls and check:
sudo tcpdump -i lo -n udp port 12201 - Logstash output is failing silently — check the Logstash log for ES errors:
sudo tail -100 /var/log/logstash/logstash-plain.log | grep -i error - Authentication failure: verify your ES password is correct with a direct curl:
curl -k -u elastic:YOUR_PASSWORD https://localhost:9200 - SSL certificate error: ensure
ssl_certificate_authoritiespoints to the correct CA cert file and that thelogstashuser can read it.
Grafana "No Data" on Panels
Symptom: Grafana datasource test passes, but panels show "No data."
Causes and fixes:
- Index pattern mismatch: the Grafana datasource index name must be
dreamfactory-logs-*(with the wildcard), matching the Logstash outputindexvalue. - Time range issue: Grafana's default time range may not overlap with when logs were indexed — try setting the time picker to "Last 7 days."
@timestampfield not mapped: Elasticsearch needs@timestampas a date field. Verify:curl -k -u elastic:YOUR_PASSWORD "https://localhost:9200/dreamfactory-logs-*/_mapping/field/@timestamp"- If the mapping is missing, delete the index and let Logstash recreate it with proper field mappings.
Logstash Configuration
Key Configuration Points
- GELF Input: Listens on UDP port 12201 for Graylog Extended Log Format (GELF) messages from DreamFactory
- JWT Extraction: Extracts
user_idfrom DreamFactory session tokens and adds it asuser.idfield - Field Mapping: Renames
hosttosource_hostnameto avoid Elasticsearch mapping conflicts - ECS Compatibility: Uses Elastic Common Schema (ECS) standard for
host.namefield - this is vendor-neutral and works across all cloud providers (AWS, Azure, GCP, etc.) and on-premise installations - Index Pattern: Creates daily indices for better performance and management
Verify Logstash is Receiving Logs
sudo netstat -tlnp | grep 12201
Check Logstash Logs
sudo tail -f /var/log/logstash/logstash-plain.log
Grafana Configuration
Step 1: Add Elasticsearch Data Source
- Go to Configuration → Data Sources
- Click Add data source
- Select Elasticsearch
- Configure:
- Name:
DreamFactory Logs - URL:
https://localhost:9200 - Access: Server (default)
- Basic Auth: Enabled
- User:
elastic - Password: Your Elasticsearch password
- User:
- TLS/SSL Mode: Skip TLS Verification
- Index name:
logstash-dreamfactory-* - Time field:
@timestamp - Version:
8.0+
- Name:
- Click Save & Test
Step 2: Add Infinity Data Source (for User Enrichment)
Prerequisites: Create a Least-Privilege API Key
Before configuring the Infinity data source, create a DreamFactory API key with minimal permissions:
- Log into DreamFactory Admin Console
- Navigate to Roles → Create a new role (e.g., "Grafana Read-Only")
- Set Role Permissions (see Role-Based Access Control for detailed information):
- Service:
system - Component:
user - Access:
GETonly (read-only) - Fields: Allow access to:
id,first_name,last_name,email(user/* in the Component section will give permission to view all user fields if needed)
- Service:
- Create API Key:
- Go to Users → Select or create a user
- Assign the "Grafana Read-Only" role to the user
- Generate an API key for this user
- Note: This API key will only have read access to user data, not full admin access
Alternative: Use Existing Role with Limited Permissions
- If you have a read-only role, you can use an existing API key with that role
- Ensure the role has GET access to
system/userendpoint
Configure Infinity Data Source:
-
Install Infinity plugin (if not already installed):
sudo grafana-cli plugins install yesoreyeram-infinity-datasource
sudo systemctl restart grafana-server -
Go to Configuration → Data Sources
-
Click Add data source
-
Select Infinity
-
Configure:
- Name:
DreamFactory API - URL:
http://localhost(or your DreamFactory URL) - Authentication: API Key
- Add header:
X-DreamFactory-API-Keywith your least-privilege API key (created in the Prerequisites section above) - Security Note: Use the read-only API key, not an admin key
- Add header:
- Name:
-
Click Save & Test
DreamFactory Integration
Step 0: Create Least-Privilege API Key for Grafana
The Infinity data source only needs read access to user data. Create a minimal-permission API key:
Option 1: Create a Custom Read-Only Role (Recommended)
- Log into DreamFactory Admin Console
- Navigate to: Roles → Create Role
- Role Configuration:
- Name:
grafana-readonly(or similar) - Description:
Read-only access for Grafana user enrichment
- Name:
- Set Service Access:
- Service:
system - Component:
user - Access:
GETonly - Fields:
id,first_name,last_name,email(or leave blank for all fields)
- Service:
- Save the role
Option 2: Use Existing Read-Only Role
If you already have a read-only role with system/user GET access, you can use that.
Create API Key with the Role
- Navigate to: Users → Select a user (or create a dedicated user like
grafana-service) - Assign Role: Add the
grafana-readonlyrole to the user - Generate API Key:
- Go to the user's profile
- Generate or copy the API key
- Store securely - this key will be used in Grafana configuration
Step 1: Enable Logstash Connector in DreamFactory
-
Log into DreamFactory Admin Console
-
Navigate to Services → System → Logstash
-
Enable the Logstash connector
-
Configure:
- Host:
localhost(or your Logstash server IP) - Port:
12201 - Protocol:
GELF (UDP) - Log Context:
Request AllService Event: (These are the Events necessary to integrate Logstash with our template Grafana Dashboard) - Event: user.* | Log level: INFO | Message: System Activity
- Event: db.* | Log Level: INFO | Default Database Activity (db is a local SQLite database typically included with all DreamFactory installations)
- Event: files.* | Log Level: INFO| File Activity
- To add your own Database or other service connection start typing the name of your service and select the service followed by * or your specfic criteria
- Host:
-
Save configuration
Step 2: Verify Logs are Being Sent
Check if DreamFactory is sending logs: (Generate some API requests or logins to see them appear in the logs)
sudo tcpdump -i any -n udp port 12201
Or check Logstash logs:
sudo tail -f /var/log/logstash/logstash-plain.log | grep dreamfactory
Step 3: Verify Logs in Elasticsearch
curl -k -u elastic:YOUR_PASSWORD "https://localhost:9200/logstash-dreamfactory-*/_search?size=1&pretty"
Dashboard Setup
Creating the User Activity Dashboard
Panel 1: Total API Calls by User
Purpose: Shows the total number of API calls made by each user with email enrichment.
Query Configuration:
- Data Source: DreamFactory Logs (Elasticsearch)
- Query Type: Count
- Query:
user.id:* event.request.method:* - Bucket Aggregations:
- Terms:
user.id(Size: 50, Order: Desc by _count)
- Terms:
- Time Field:
@timestamp
Second Query (for email enrichment):
- Data Source: DreamFactory API (Infinity)
- Type: JSON
- URL:
/api/v2/system/user?fields=id,first_name,last_name,email&limit=100 - Parser: Backend
- Root Selector:
resource
Transformations:
- Join by field: Join query A and B on
user.id(Mode: Outer) - Organize fields:
- Exclude:
first_name B,last_name B,user.id,user.id 1,user.id 2 - Rename:
Count→Total API Calls,email B→User Email
- Exclude:
- Filter data by values:
- Field:
Total API Calls - Condition:
IS NOT NULL
- Field:
Field Mappings:
- Map empty/null email values to "Admin User"
The Dashboard should end up looking similar to this:
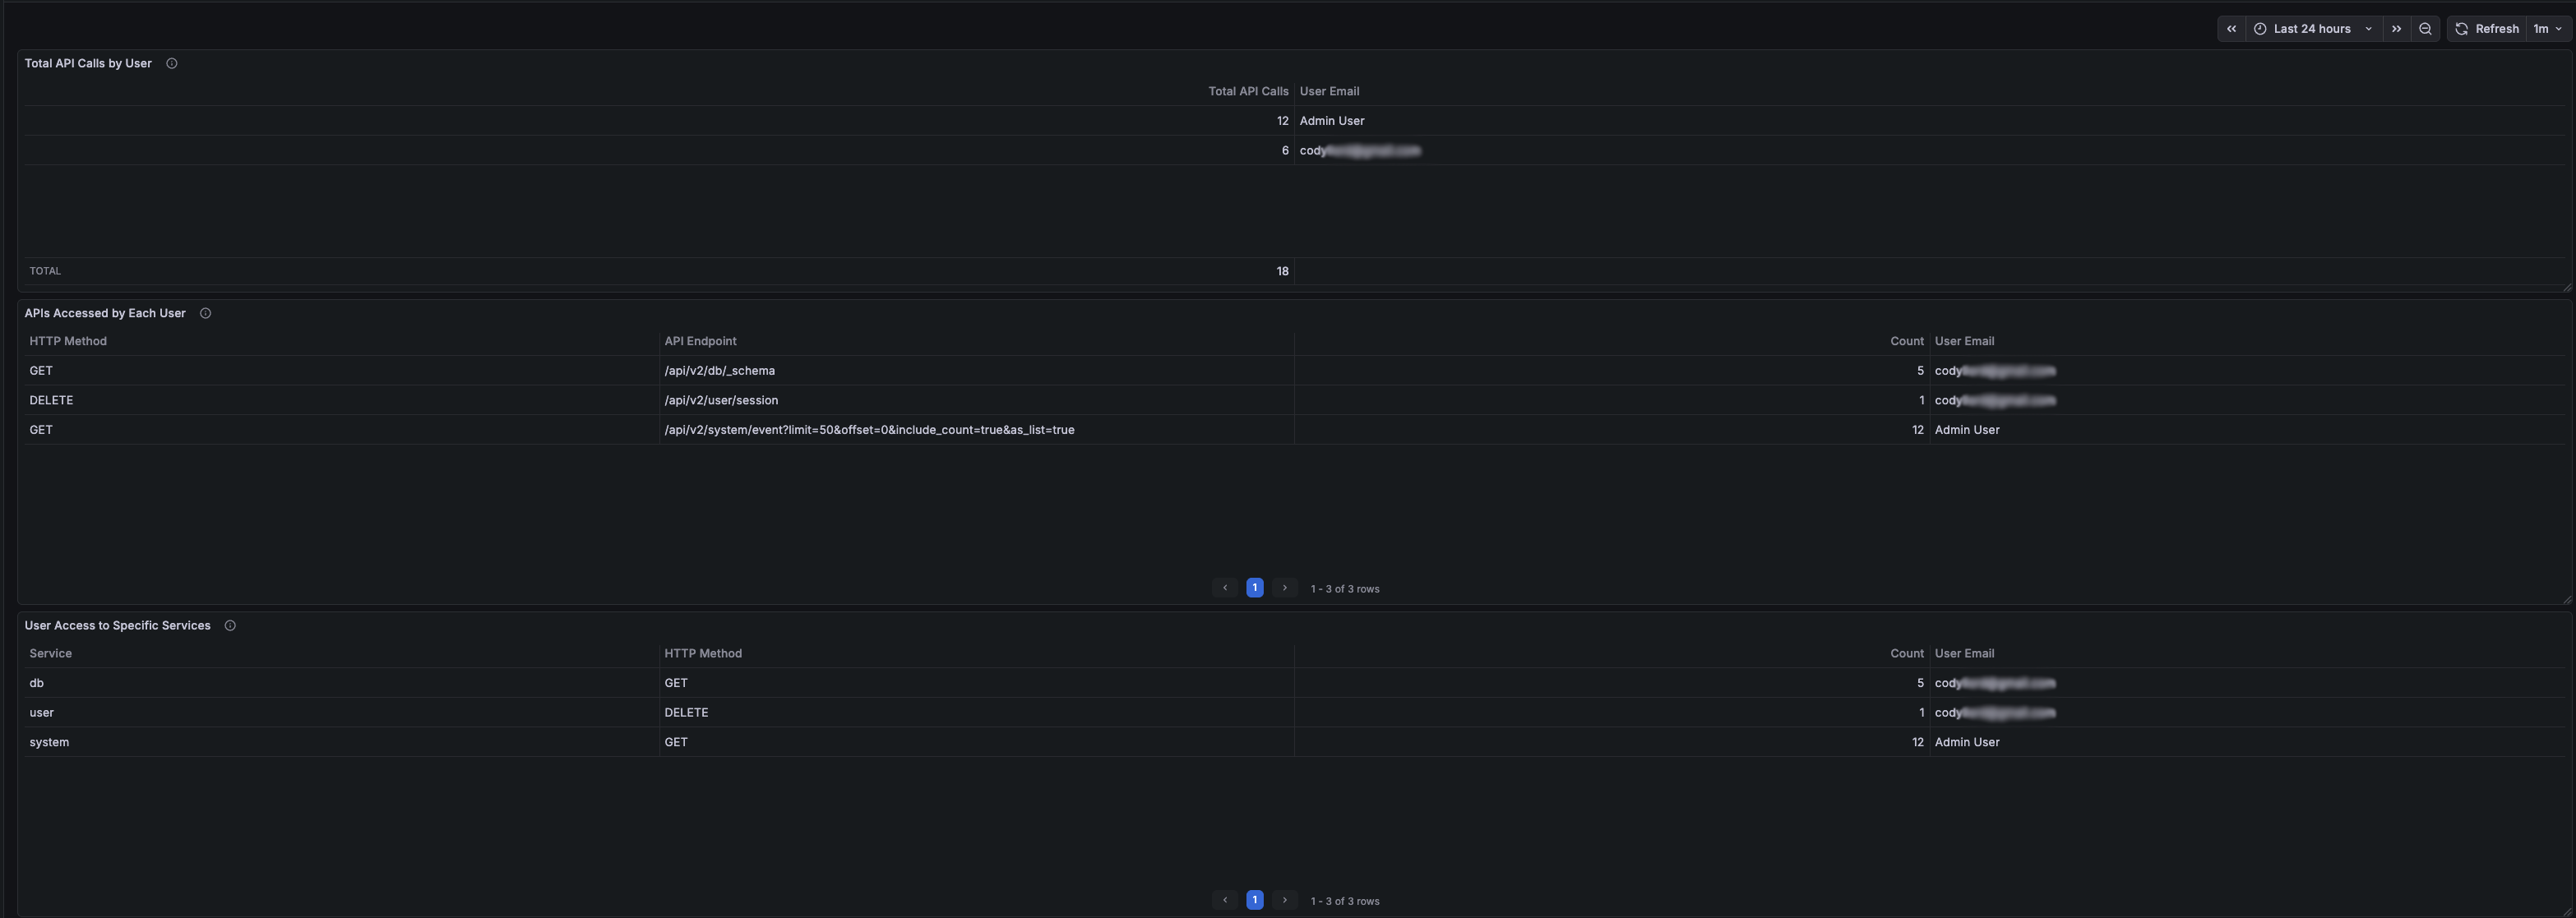
When there are no calls in the selected time frame for a user the panels should all be empty as the filters we applied should remove any row with no calls.
Panel 2: APIs Accessed by Each User
Purpose: Shows which specific API endpoints each user accessed with HTTP method details.
Query Configuration:
- Data Source: DreamFactory Logs (Elasticsearch)
- Query Type: Count
- Query:
user.id:* event.request.method:* event.request.uri:* - Bucket Aggregations:
- Terms:
user.id(Size: 20, Order: Desc by _count) - Terms:
event.request.method.keyword(Size: 10, Order: Desc by _count) - Terms:
event.request.uri.keyword(Size: 25, Order: Desc by _count)
- Terms:
- Time Field:
@timestamp
Second Query (for email enrichment):
- Same as Panel 1
Transformations:
- Join by field: Join on
user.id(Mode: Outer Tabular) - Organize fields:
- Exclude:
first_name B,last_name B,user.id,user.id 1,user.id 2 - Rename:
email B→User Emailevent.request.method.keyword→HTTP Methodevent.request.uri.keyword→API Endpoint
- Exclude:
- Filter data by values:
- Field:
Count(or your count column) - Condition:
IS NOT NULL
- Field:
Panel 3: User Access to Specific Services
Purpose: Shows which DreamFactory services each user accessed.
Query Configuration:
- Data Source: DreamFactory Logs (Elasticsearch)
- Query Type: Count
- Query:
user.id:* event.request.method:* event.request.service:* - Bucket Aggregations:
- Terms:
user.id(Size: 20, Order: Desc by _count) - Terms:
event.request.service.keyword(Size: 15, Order: Desc by _count) - Terms:
event.request.method.keyword(Size: 10, Order: Desc by _count)
- Terms:
- Time Field:
@timestamp
Second Query (for email enrichment):
- Same as Panel 1
Transformations:
- Join by field: Join on
user.id(Mode: Outer Tabular) - Organize fields:
- Exclude:
first_name B,last_name B,user.id,user.id 1,user.id 2 - Rename:
email B→User Emailevent.request.method.keyword→HTTP Methodevent.request.service.keyword→Service
- Exclude:
- Filter data by values:
- Field:
Count - Condition:
IS NOT NULL
- Field:
Dashboard Settings
Time Range: Set to "Last 24 hours" (adjustable)
Refresh Interval: 1 minute (recommended)
Tags: dreamfactory, users, api, activity
Dashboard Function and Use
Overview
The dashboard provides comprehensive visibility into DreamFactory API usage by individual users, helping administrators:
- Monitor User Activity: See which users are actively using the API
- Identify API Usage Patterns: Understand which endpoints and services are most accessed
- Troubleshoot Issues: Track user-specific API calls for debugging
- Security Auditing: Monitor API access patterns for security analysis
Key Features
User Identification
- User ID Extraction: Automatically extracts user IDs from JWT session tokens
- Email Enrichment: Joins with DreamFactory user database to show email addresses
- Admin User Handling: Maps null/empty emails to "Admin User" for system-level operations
Data Filtering
- Method-Based Filtering: Only shows users with actual HTTP method calls (GET, POST, etc.)
- Complete Data Only: Filters out rows with missing data using transformation filters
- Real-Time Updates: Refreshes every minute to show current activity
Aggregation Levels
- User-Level: Total calls per user
- Endpoint-Level: Specific API endpoints accessed
- Service-Level: DreamFactory services accessed (db, system, files, etc.)
Use Cases
-
Activity Monitoring
- Identify most active users
- Track API usage trends
- Monitor system load by user
-
Troubleshooting
- Find which user made a specific API call
- Track user-specific errors
- Debug authentication issues
-
Security Auditing
- Monitor unusual access patterns
- Track service access by user
- Identify potential security issues
-
Capacity Planning
- Understand API usage patterns
- Plan for user growth
- Optimize service performance
Interpreting the Data
- Total API Calls: Sum of all HTTP requests made by a user
- HTTP Method: Type of request (GET, POST, PUT, DELETE, etc.)
- API Endpoint: Specific DreamFactory API path accessed
- Service: DreamFactory service category (db, system, files, etc.)
- User Email: Email address from DreamFactory user database (or "Admin User" for system operations)
Maintenance
Regular Tasks
-
Monitor Disk Space: Elasticsearch indices can grow large
curl -k -u elastic:YOUR_PASSWORD "https://localhost:9200/_cat/indices?v" -
Index Management: Consider setting up index lifecycle management
# Delete old indices (example: older than 30 days)
curl -k -u elastic:YOUR_PASSWORD -X DELETE "https://localhost:9200/logstash-dreamfactory-2024.12.*" -
Log Rotation: Monitor Logstash logs
sudo logrotate -d /etc/logrotate.d/logstash -
Performance Monitoring: Check Elasticsearch cluster health
curl -k -u elastic:YOUR_PASSWORD "https://localhost:9200/_cluster/health?pretty"
If you have any issues or need help with a specifc Grafana dashboard panel please reach out to DreamFactory support!